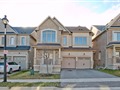
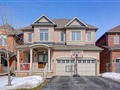
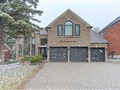
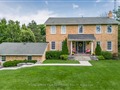
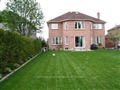
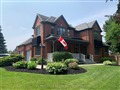
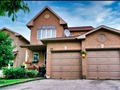
1103 Sherman Brock Circ
$1,794,177
Comparative Market Analysis
Jun 25, 2025
NOT AN ACTIVE LISTING
Historical Performance
| Period | $ Change | % Change |
| 1 Day | +$471 | +0.026% |
| 7 Days | +$494 | +0.028% |
| 30 Days | -$1,923 | -0.107% |
| 3 Months | +$19 | +0.001% |
| 6 Months | +$42.8k | +2.45% |
| 1 Year | -$46.0k | -2.50% |
| 3 Years | +$413k | +29.9% |
| 5 Years | +$566k | +46.1% |
| 10 Years | +$1.02m | +133% |
List My Property
Real Estate Statistics
Financing Solutions
Browsing History
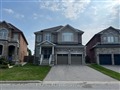
1076 Sherman Brock Circ, Newmarket
1 second ago
AS SEEN ON

Are You a Licensed Real Estate Agent or Broker?