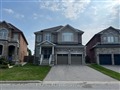
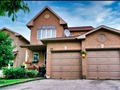
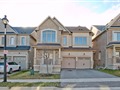
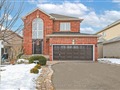
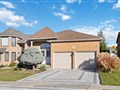
1135 Grainger Tr
$1,662,982
Comparative Market Analysis
Jun 25, 2025
NOT AN ACTIVE LISTING
Historical Performance
| Period | $ Change | % Change |
| 1 Day | +$436 | +0.026% |
| 7 Days | +$57 | +0.003% |
| 30 Days | -$3,819 | -0.229% |
| 3 Months | -$7,185 | -0.430% |
| 6 Months | +$23.0k | +1.41% |
| 1 Year | -$91.4k | -5.21% |
| 3 Years | +$200k | +13.7% |
| 5 Years | +$362k | +27.8% |
| 10 Years | +$848k | +104% |
List My Property
Real Estate Statistics
Financing Solutions
AS SEEN ON


Are You a Licensed Real Estate Agent or Broker?