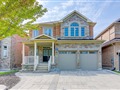
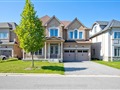
1143 Quaker Tr
$2,151,049
Comparative Market Analysis
Jun 4, 2025
NOT AN ACTIVE LISTING
Historical Performance
| Period | $ Change | % Change |
| 1 Day | +$565 | +0.026% |
| 7 Days | +$73 | +0.003% |
| 30 Days | -$4,940 | -0.229% |
| 3 Months | -$9,293 | -0.430% |
| 6 Months | +$29.8k | +1.41% |
| 1 Year | -$114k | -5.02% |
| 3 Years | +$354k | +19.7% |
| 5 Years | +$552k | +34.6% |
| 10 Years | +$1.15m | +115% |
List My Property
Real Estate Statistics
Financing Solutions
Browsing History
675 Gibney Cres 675, Newmarket
1 second ago
727 Greenfield Cres, Newmarket
1 second ago
678 Irwin Cres, Newmarket
2 seconds ago
821 Pucks Pl, Newmarket
3 seconds ago
597 Willowick Dr, Newmarket
3 seconds ago
693 Sunnypoint Dr, Newmarket
3 seconds ago
799 Sunnypoint Dr, Newmarket
3 seconds ago
623 Gibney Cres TH, Newmarket
5 seconds ago
20 Lytham Green Circ 7, Newmarket
5 seconds ago
443 Weddel Crt, Newmarket
5 seconds ago
AS SEEN ON


Are You a Licensed Real Estate Agent or Broker?