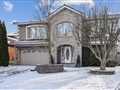
278 Plymouth Tr
$1,267,630
Comparative Market Analysis
Jun 25, 2025
NOT AN ACTIVE LISTING
Historical Performance
| Period | $ Change | % Change |
| 1 Day | +$377 | +0.030% |
| 7 Days | +$2,041 | +0.161% |
| 30 Days | +$7,458 | +0.592% |
| 3 Months | +$36.4k | +2.95% |
| 6 Months | +$124k | +10.9% |
| 1 Year | +$165k | +15.0% |
| 3 Years | +$357k | +39.2% |
| 5 Years | +$457k | +56.3% |
| 10 Years | +$726k | +134% |
List My Property
Real Estate Statistics
Financing Solutions
Browsing History
288 Plymouth Tr, Newmarket
1 second ago
AS SEEN ON


Are You a Licensed Real Estate Agent or Broker?