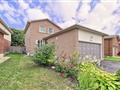
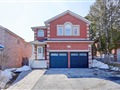
286 Sheridan Crt
$1,183,053
Comparative Market Analysis
Jun 29, 2025
NOT AN ACTIVE LISTING
Historical Performance
| Period | $ Change | % Change |
| 1 Day | +$345 | +0.029% |
| 7 Days | +$155 | +0.013% |
| 30 Days | -$2,490 | -0.210% |
| 3 Months | -$4,954 | -0.417% |
| 6 Months | +$16.2k | +1.39% |
| 1 Year | -$59.7k | -4.80% |
| 3 Years | +$219k | +22.7% |
| 5 Years | +$376k | +46.5% |
| 10 Years | +$688k | +139% |
List My Property
Real Estate Statistics
Financing Solutions
AS SEEN ON


Are You a Licensed Real Estate Agent or Broker?