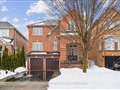
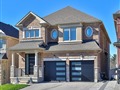
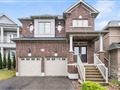
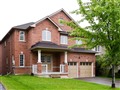
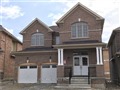
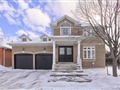
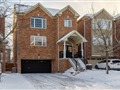
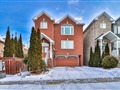
411 Gilpin Dr
$1,794,665
Comparative Market Analysis
Jun 4, 2025
NOT AN ACTIVE LISTING
Historical Performance
| Period | $ Change | % Change |
| 1 Day | +$508 | +0.028% |
| 7 Days | +$286 | +0.016% |
| 30 Days | -$3,361 | -0.187% |
| 3 Months | -$5,755 | -0.320% |
| 6 Months | +$28.9k | +1.63% |
| 1 Year | -$83.0k | -4.42% |
| 3 Years | +$336k | +23.0% |
| 5 Years | +$478k | +36.3% |
| 10 Years | +$1.02m | +130% |
List My Property
Real Estate Statistics
Financing Solutions
AS SEEN ON


Are You a Licensed Real Estate Agent or Broker?