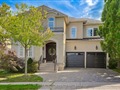
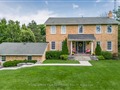
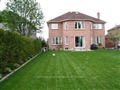
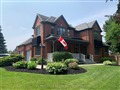
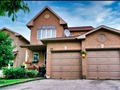
533 Lyman Blvd
$1,602,478
Comparative Market Analysis
Jun 26, 2025
NOT AN ACTIVE LISTING
Historical Performance
| Period | $ Change | % Change |
| 1 Day | +$421 | +0.026% |
| 7 Days | +$54 | +0.003% |
| 30 Days | -$3,680 | -0.229% |
| 3 Months | -$6,923 | -0.430% |
| 6 Months | +$22.2k | +1.41% |
| 1 Year | -$84.6k | -5.02% |
| 3 Years | +$263k | +19.7% |
| 5 Years | +$412k | +34.6% |
| 10 Years | +$856k | +115% |
List My Property
Real Estate Statistics
Financing Solutions
Browsing History
647 Tapestry Lane, Newmarket
3 seconds ago
AS SEEN ON

Are You a Licensed Real Estate Agent or Broker?