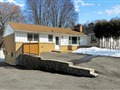
536 Londry Crt
$1,412,877
Comparative Market Analysis
Jul 7, 2025
NOT AN ACTIVE LISTING
Historical Performance
| Period | $ Change | % Change |
| 1 Day | +$412 | +0.029% |
| 7 Days | +$483 | +0.034% |
| 30 Days | -$1,500 | -0.106% |
| 3 Months | -$1,014 | -0.072% |
| 6 Months | +$29.8k | +2.16% |
| 1 Year | -$48.5k | -3.32% |
| 3 Years | +$310k | +28.1% |
| 5 Years | +$511k | +56.6% |
| 10 Years | +$840k | +147% |
List My Property
Real Estate Statistics
Financing Solutions
AS SEEN ON


Are You a Licensed Real Estate Agent or Broker?