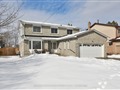
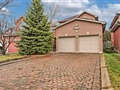
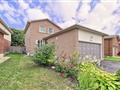
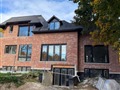
540 Londry Crt
$1,437,644
Comparative Market Analysis
Jun 6, 2025
NOT AN ACTIVE LISTING
Historical Performance
| Period | $ Change | % Change |
| 1 Day | +$420 | +0.029% |
| 7 Days | +$189 | +0.013% |
| 30 Days | -$3,026 | -0.210% |
| 3 Months | -$6,020 | -0.417% |
| 6 Months | +$19.7k | +1.39% |
| 1 Year | -$75.5k | -4.99% |
| 3 Years | +$222k | +18.3% |
| 5 Years | +$376k | +35.5% |
| 10 Years | +$790k | +122% |
List My Property
Real Estate Statistics
Financing Solutions
Browsing History
93 Lambeth Crt, Newmarket
1 second ago
546 Tugwell Pl, Newmarket
2 seconds ago
312 Roywood Cres, Newmarket
2 seconds ago
321 Roywood Cres, Newmarket
2 seconds ago
AS SEEN ON


Are You a Licensed Real Estate Agent or Broker?