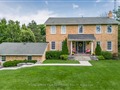
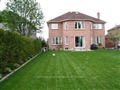
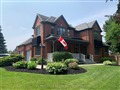
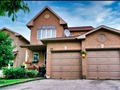
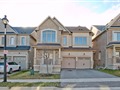
579 Lyman Blvd
$1,699,893
Comparative Market Analysis
Jun 25, 2025
NOT AN ACTIVE LISTING
Historical Performance
| Period | $ Change | % Change |
| 1 Day | +$446 | +0.026% |
| 7 Days | +$74 | +0.004% |
| 30 Days | -$3,822 | -0.224% |
| 3 Months | -$7,078 | -0.415% |
| 6 Months | +$24.1k | +1.44% |
| 1 Year | -$88.5k | -4.95% |
| 3 Years | +$284k | +20.0% |
| 5 Years | +$444k | +35.4% |
| 10 Years | +$917k | +117% |
List My Property
Real Estate Statistics
Financing Solutions
Browsing History
646 Foxcroft Blvd, Newmarket
2 seconds ago
804 Foxcroft Blvd, Newmarket
3 seconds ago
535 Heddle Cres, Newmarket
4 seconds ago
826 Srigley St, Newmarket
5 seconds ago
191 Currey Cres, Newmarket
6 seconds ago
1006 Nellie Little Cres, Newmarket
7 seconds ago
962 Damascus Crt, Newmarket
8 seconds ago
987 Ivsbridge Blvd, Newmarket
9 seconds ago
835 Alfred Crt, Newmarket
10 seconds ago
274 Currey Cres, Newmarket
11 seconds ago
AS SEEN ON

Are You a Licensed Real Estate Agent or Broker?