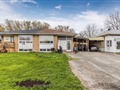
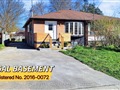
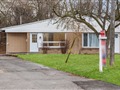
239 Silverbirch Dr
$671,394
Comparative Market Analysis
May 1, 2024
NOT AN ACTIVE LISTING
Historical Performance
| Period | $ Change | % Change |
| 1 Day | +$334 | +0.050% |
| 7 Days | +$707 | +0.105% |
| 30 Days | -$962 | -0.143% |
| 3 Months | -$3,085 | -0.457% |
| 6 Months | +$8,504 | +1.28% |
| 1 Year | -$34.2k | -4.85% |
| 3 Years | +$101k | +17.7% |
| 5 Years | +$171k | +34.2% |
| 10 Years | +$353k | +111% |
List My Property
Real Estate Statistics
Financing Solutions
AS SEEN ON


Are You a Licensed Real Estate Agent or Broker?